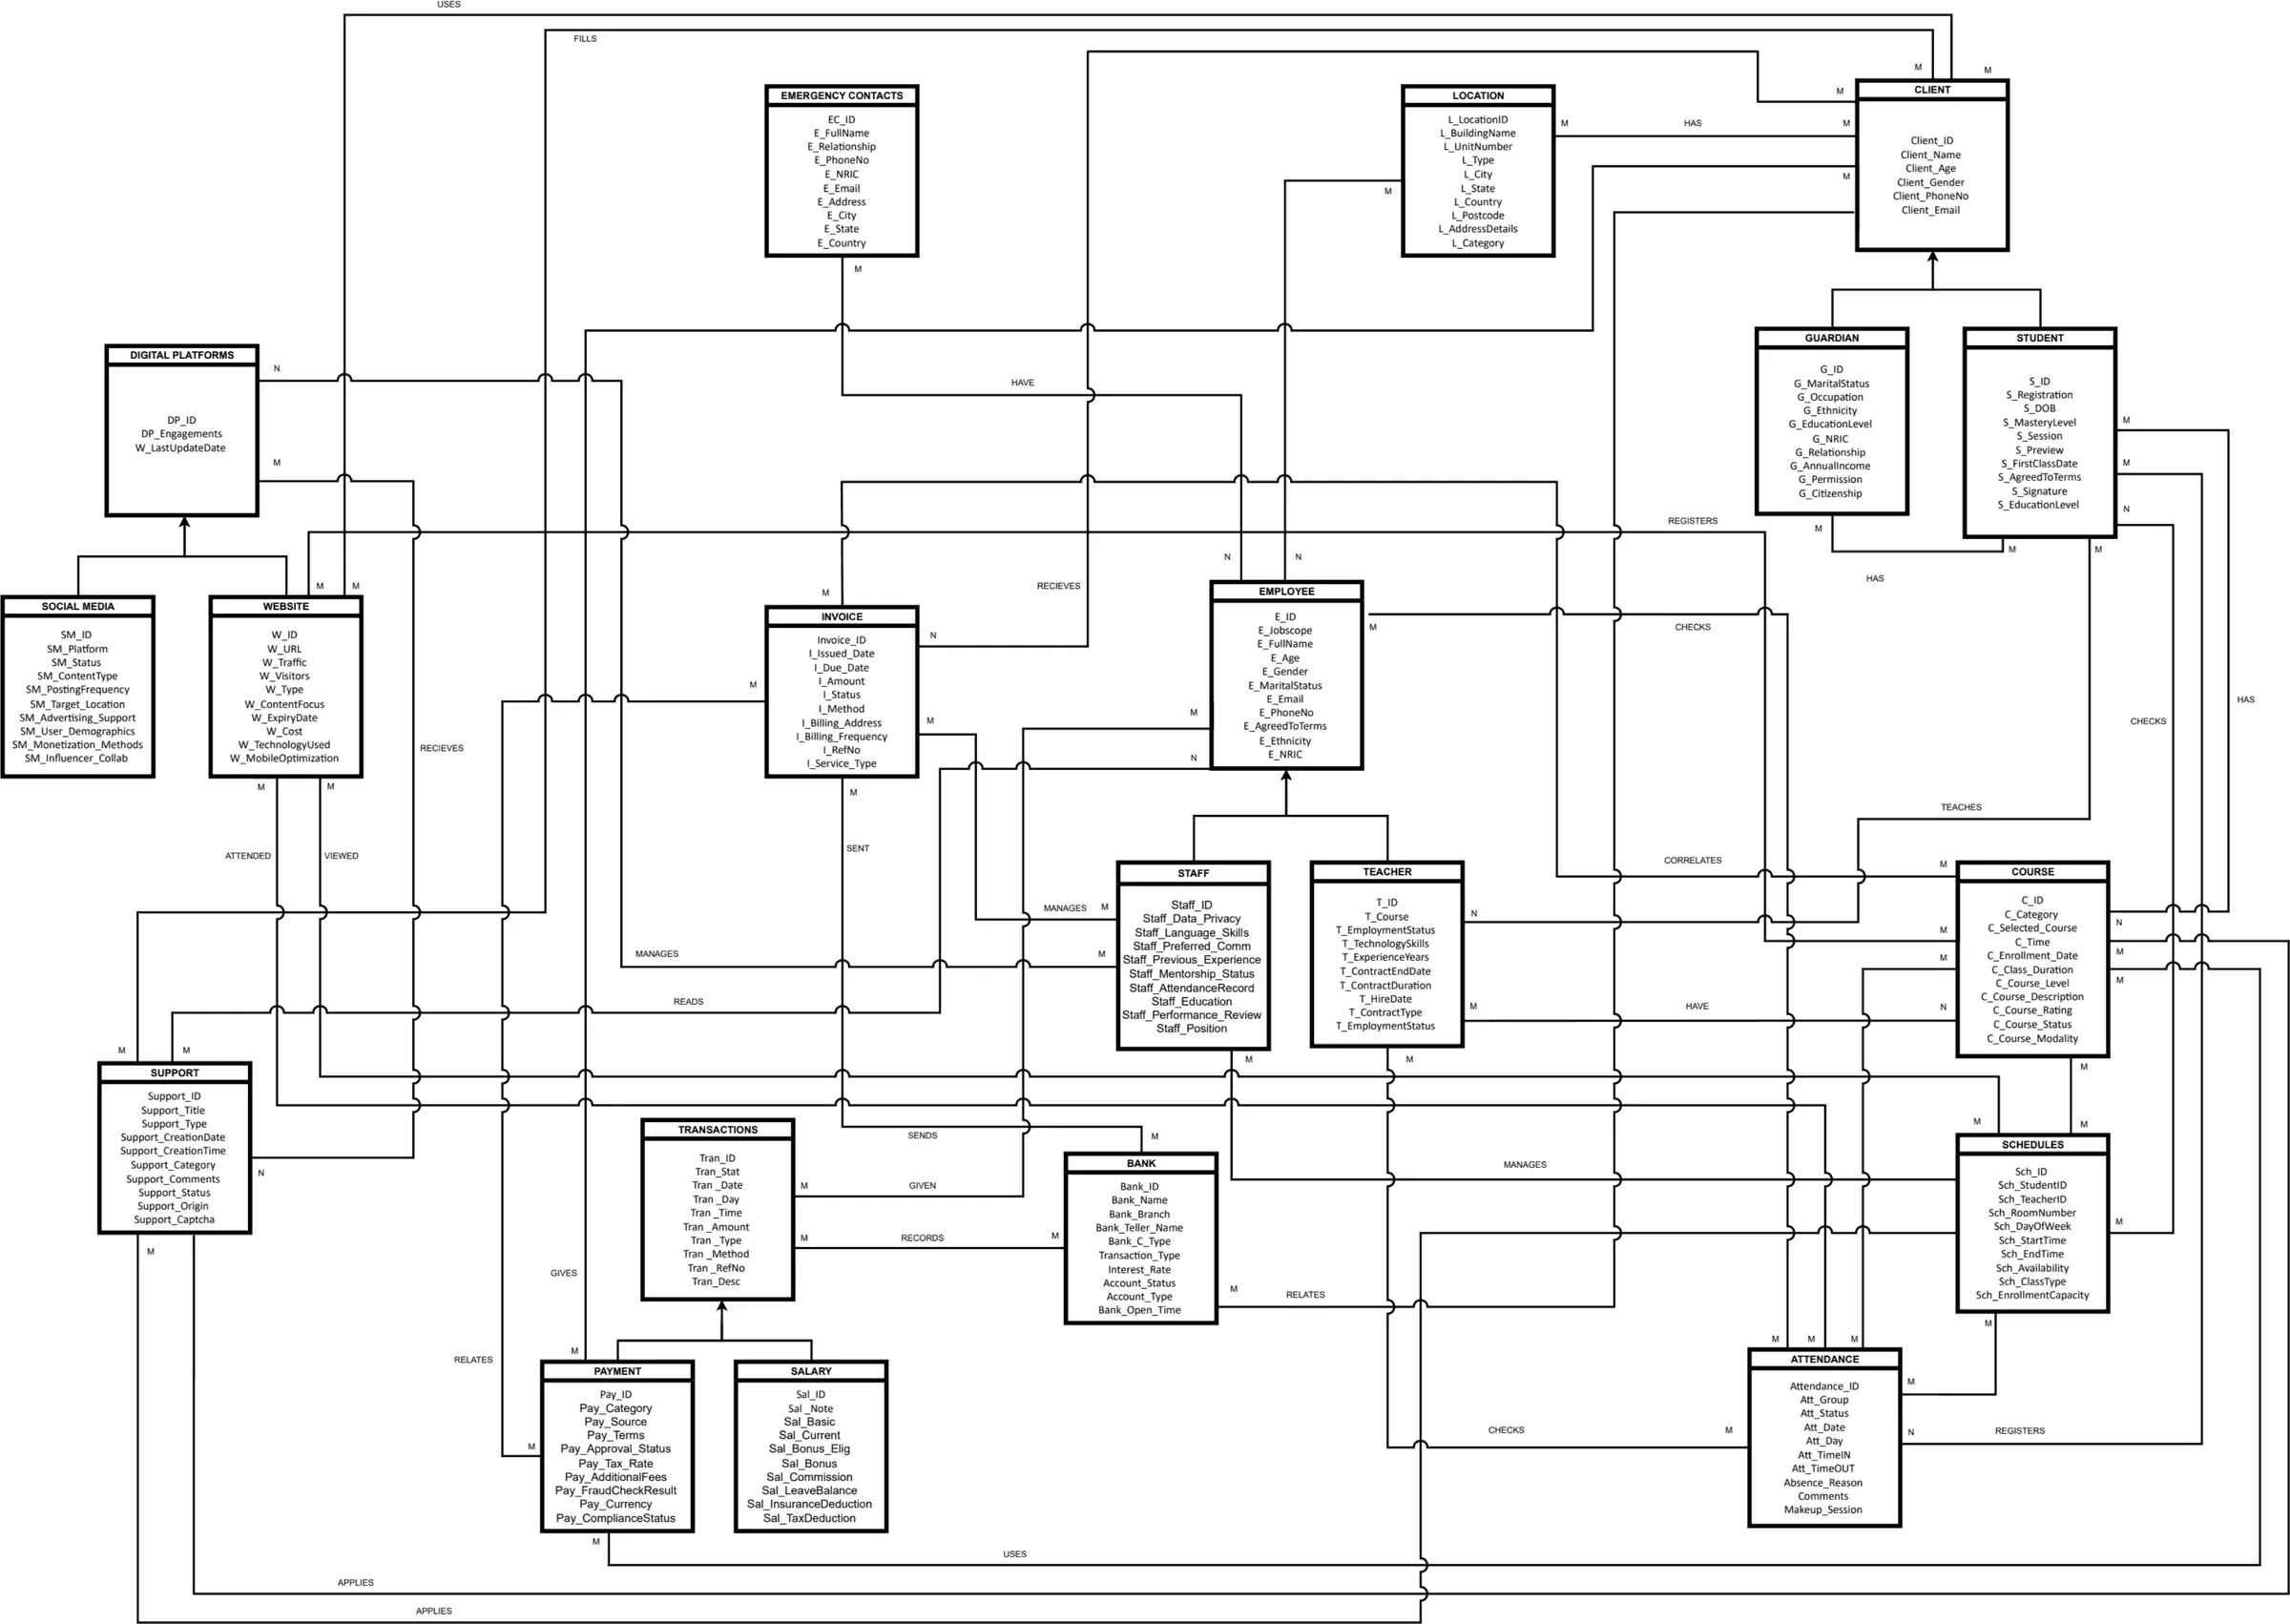
The other database from my UTP days models Jom Al-Quran, a business running Quran and Arabic classes: students and their guardians, teachers and their schedules, courses, invoices, payments, and the websites and social media behind it all. It was a group assignment, built in Oracle like the company one.
56 tables
1,459 rows
80 foreign keys
0 broken links
Bringing it back
The original lived in a Word report: Oracle SQL and screenshots, runnable only on a lab machine. I had an AI coding agent port it to SQLite, repair the three typos that stopped it loading (two split inserts, 120 missing semicolons and two malformed foreign keys), check every relationship, and wrap it in tests. Every table, column and row is otherwise exactly as we submitted it.
For this page, the names, IC numbers, emails and phone numbers are all replaced with obviously fake ones. Each original maps to the same fake value everywhere, so every join still lines up.
Try it yourself
The report's five queries are below, including one that walks through thirteen tables to get from a guardian to their payment. Run them, open any table (or one of the views, in teal), or write your own. It all runs in your browser.
Scroll here to load the database.
Browse a table (20 main tables and 6 views)
SELECT 'Students' AS who, count(*) AS how_many FROM Student
UNION ALL SELECT 'Teachers', count(*) FROM Teacher
UNION ALL SELECT 'Clients', count(*) FROM Client
UNION ALL SELECT 'Courses', count(*) FROM Course;
SELECT
dp.DP_Engagements,
w.W_URL
FROM Digital_Platforms dp
JOIN Website w ON w.DP_ID = dp.DP_ID
ORDER BY dp.DP_Engagements DESC;
SELECT
s.Staff_Position,
e.E_FullName,
tr.Tran_Amount,
COUNT(tr.Tran_Date) AS Transaction_Count
FROM Staff s
JOIN Employee e ON e.E_ID = s.E_ID
JOIN EmployeeTransactions et ON et.E_ID = e.E_ID
JOIN Transactions tr ON tr.Tran_ID = et.Tran_ID
WHERE e.E_Gender = 'F'
OR tr.Tran_Type = 'Monthly'
GROUP BY s.Staff_Position, e.E_FullName, tr.Tran_Amount, tr.Tran_Date
ORDER BY s.Staff_Position;
SELECT
e.E_FullName,
e.E_Jobscope,
t.T_Course,
t.T_EmploymentStatus,
l.L_LocationID,
l.L_AddressDetails,
s.S_ID,
s.S_MasteryLevel,
c.C_ID,
c.C_Selected_Course,
sc.Sch_ID,
sc.Sch_DayOfWeek
FROM Employee e
JOIN Teacher t ON t.E_ID = e.E_ID
JOIN EmployeeLocation el ON el.E_ID = e.E_ID
JOIN Location l ON l.L_LocationID = el.L_LocationID
JOIN StudentTeacher st ON st.T_ID = t.T_ID
JOIN Student s ON s.S_ID = st.S_ID
JOIN StudentCourse cs ON cs.S_ID = s.S_ID
JOIN Course c ON c.C_ID = cs.C_ID
JOIN TeacherSchedule ts ON ts.T_ID = t.T_ID
JOIN Schedule sc ON sc.Sch_ID = ts.Sch_ID
WHERE t.T_ContractType = 'Full Time'
AND c.C_Course_Rating > 4.0
AND s.S_MasteryLevel = 'Quran'
AND s.S_Session = '1'
ORDER BY e.E_FullName, s.S_ID;
SELECT
s.S_ID,
cl.Client_Name AS "Guaridan Name",
g.G_MaritalStatus,
b.Bank_Name,
i.I_Amount,
tr.Tran_Amount,
p.Pay_ID,
sup.Support_Type
FROM Client cl
JOIN Guardian g ON g.Client_ID = cl.Client_ID
JOIN StudentGuardian sg ON sg.G_ID = g.G_ID
JOIN Student s ON s.S_ID = sg.S_ID
JOIN BankClient bc ON bc.Client_ID = cl.Client_ID
JOIN Bank b ON b.Bank_ID = bc.Bank_ID
JOIN ClientInvoice ci ON ci.Client_ID = cl.Client_ID
JOIN Invoice i ON i.Invoice_ID = ci.Invoice_ID
JOIN BankTransactions bt ON bt.Bank_ID = b.Bank_ID
JOIN Transactions tr ON tr.Tran_ID = bt.Tran_ID
JOIN Payment p ON p.Tran_ID = tr.Tran_ID
JOIN ClientSupport cs ON cs.Client_ID = cl.Client_ID
JOIN Support sup ON sup.Support_ID = cs.Support_ID
WHERE cl.C_Gender = 'M'
AND sup.Support_Origin = 'Web'
AND p.Pay_Approval_Status = 'Approved'
AND s.S_Session = '2'
ORDER BY s.S_ID DESC;
SELECT *
FROM v_staff_monthly_transactions
ORDER BY E_ID;
How the tables connect
This is the diagram we drew in 2024. It was buried in the report as an embedded drawing, so it never made it into the first port. The arrows are subtypes: a guardian and a student are both kinds of client, a teacher is a kind of employee, a payment is a kind of transaction.
The 2024 EER diagram. Open it full size to read the attributes.
A drawing that busy doesn't help you write a query, so here is the same schema as a map you can use. Pick the tables you care about. The atlas finds the shortest route between them, writes the JOINs and runs them. Switch to As we drew it in 2024 to put every table back where we placed it, or pick one table to see how it drifted from what the report documented.
Subtype of, from the 2024 diagramLink table, one-to-one in the dataLink table, really one-to-manyLink table, genuinely many-to-manyLink table (hover a diamond)
Pick from a list instead
Scroll here to load the database.
Scroll here to load the database.
What I'd design differently now
Running it properly also meant reading it critically. It loads cleanly and every query works, but with a few years of hindsight:
Too many link tables. 36 of the 56 tables are link tables, and in the data most of them are really one-to-many. A single foreign key would do, and query four wouldn't need thirteen tables.
One person, three tables. The diagram makes guardians and students subtypes of client, but a parent's own row and their child's row are only tied together through a link table. The atlas's query-four preset shows what happens when you join them the short way: no rows. Today I'd have one Person table and roles on top.
The same fact stored twice. Schedules record their student and teacher directly and in two link tables. They agree now, which is exactly when duplicates look harmless.
The documentation drifted. The report's schema list and its CREATE TABLEs disagree on a few tables. A test that checks one against the other would have caught it.
None of that is a reason to be embarrassed by it. It's the same lesson every project since has taught me: write the model down, then check the real thing against it.